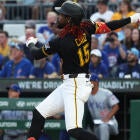
By the Numbers: Feats of Clay
Our Al Melchior examines the recent struggles of Clay Buchholz and the immediate success of Florida's Chris Volstad in his latest edition of By the Numbers.
Some owners who were enthralled when Red Sox rookie Clay Buchholz was re-called just over two weeks ago are already starting to lose patience. He has failed to make it out of the sixth inning in each of his three starts since being brought back. Owners who were hoping he would lower his mid-5.00s ERA have been disappointed as it continues to climb. In the past week, Buchholz has been dropped from active rosters in nine percent of CBSSports.com leagues, and he has been dumped altogether from five percent of our leagues.
Buchholz could stand to cut down on his 4.6 BB/9 rate, which would help both his 5.81 ERA and 1.71 WHIP, but mostly he just needs better luck. 37 percent of balls hit in play against him have become base hits, which translates to Buchholz giving up 14 more hits to date than what would be expected. Even without reducing his walks, with a normal H/BIP rate, Buchholz' WHIP would be sliced to 1.47. That's still not all that attractive, but it is a dramatic improvement. Realistically, his WHIP going forward will be even lower still, because he doesn't have a history of control problems and his walk rate should come down. He does have a history of striking out more than a batter an inning, and he is already repeating that feat as a major leaguer. Buchholz is a bargain buy for owners in AL-only leagues, and a good Scout Team target for mixed league owners.
Buchholz has the skills profile to be a very good pitcher for a long time. So does Florida phenom Chris Volstad, though he has had a different formula for success. His fastball doesn't have Buchholz' zip and he gets fewer strikeouts, but he excels with superb command and inducing ground ball outs. Perhaps someday Volstad can maintain an ERA in the low-2.00s, but he won't be doing it with his current skill set. His 2.38 ERA and 1.19 WHIP have benefited from an H/BIP rate that is 10 percentage points lower than that of Buchholz. Given Volstad's ground ball tendencies, his normal H/BIP would actually be a little higher than that of the Red Sox righty. Volstad would be a good pickup for mixed or NL-only leagues, but he might be an even better pitcher to trade away, if you can find an owner who believes in his current stats.
Kenji Johjima has been more or less of a permanent resident on the "Unlucky Hitters" list, and now his catching mate, Jeff Clement, has joined him. Clement is doubly unlucky, because in addition to a 21 percent H/BIP rate, he has missed several games with a torn fingernail. His current owners should wait out his misfortunes. While his injury and rookie slump are both painful, he will recover from both. He hits for far too much power to stay below the Mendoza line for too long.
All statistics below are for season-to-date performances through Saturday, July 26.
| 'Lucky' Hitters | H/BIP | RC/27 | 'Lucky' Pitchers | H/BIP | ERC |
| Ian Stewart, 3B, Colorado | 48% | 7.5 | Brandon Morrow, RP, Seattle | 16% | 1.64 |
| Denard Span, OF, Minnesota | 41% | 7.3 | Yusmeiro Petit, SP, Arizona | 20% | 1.78 |
| Howie Kendrick, 2B, L.A. Angels | 41% | 6.4 | Justin Duchscherer, SP, Oakland | 22% | 2.00 |
| Edgar V. Gonzalez, 2B, San Diego | 38% | 5.0 | Armando Galarraga, SP, Detroit | 23% | 3.06 |
| Jeff Baker, 1B, Colorado | 37% | 6.6 | Gavin Floyd, SP, Chicago White Sox | 23% | 3.58 |
| Fernando Tatis, 3B, N.Y. Mets | 37% | 6.1 | Shaun Marcum, SP, Toronto | 23% | 2.81 |
| Xavier Nady, OF, N.Y. Yankees | 36% | 7.5 | Ryan Dempster, SP, Chicago Cubs | 25% | 2.87 |
| Fred Lewis, OF, San Francisco | 36% | 5.7 | Scott Olsen, SP, Florida | 25% | 3.96 |
| Ryan Sweeney, OF, Oakland | 36% | 5.3 | Jorge Campillo, RP, Atlanta | 26% | 2.48 |
| Kelly Shoppach, C, Cleveland | 35% | 5.0 | Chris Volstad, SP, Florida | 27% | 2.72 |
| Unlucky' Hitters | H/BIP | RC/27 | 'Unlucky' Pitchers | H/BIP | ERC |
| John Baker, C, Florida | 16% | 2.8 | J.J. Putz, RP, Seattle | 39% | 5.42 |
| Jonny Gomes, OF, Tampa Bay | 20% | 4.7 | Clay Buchholz, SP, Boston | 37% | 5.73 |
| Jeff Clement, C, Seattle | 21% | 2.9 | Jorge De La Rosa, SP, Colorado | 36% | 5.43 |
| Kenji Johjima, C, Seattle | 22% | 2.2 | Matt Lindstrom, RP, Florida | 36% | 4.20 |
| Troy Tulowitzki, SS, Colorado | 23% | 2.7 | Brian Wilson, RP, San Francisco | 35% | 4.57 |
| Juan Rivera, OF, L.A. Angels | 24% | 4.1 | Rafael Betancourt, RP, Cleveland | 35% | 4.91 |
| Ronnie Belliard, 2B, Washington | 24% | 5.2 | Bronson Arroyo, SP, Cincinnati | 34% | 5.68 |
| Eugenio Velez, 2B, San Francisco | 25% | 2.3 | Nate Robertson, SP, Detroit | 34% | 5.41 |
| Mark Ellis, 2B, Oakland | 25% | 4.5 | Arthur Rhodes, RP, Seattle | 34% | 2.35 |
| Austin Kearns, OF, Washington | 25% | 3.3 | Darrell Rasner, SP, N.Y. Yankees | 34% | 4.91 |
| Good stats, good skills - hitters | H/BIP | RC/27 | Good stats, good skills - pitchers | H/BIP | ERC |
| Matt Joyce, OF, Detroit | 28% | 8.3 | Derek Lowe, SP, L.A. Dodgers | 29% | 3.06 |
| J.D. Drew, OF, Boston | 32% | 7.9 | Jair Jurrjens, SP, Atlanta | 29% | 3.15 |
| Mike Fontenot, 2B, Chicago Cubs | 31% | 7.5 | James Shields, SP, Tampa Bay | 29% | 3.21 |
| Rick Ankiel, OF, St. Louis | 31% | 6.8 | Kyle Lohse, SP, St. Louis | 29% | 3.28 |
| Edwin Encarnacion, 3B, Cincinnati | 27% | 6.2 | Matt Garza, SP, Tampa Bay | 27% | 3.53 |
| Poor stats, poor skills - hitters | H/BIP | RC/27 | Poor stats, poor skills - pitchers | H/BIP | ERC |
| Freddy Sanchez, 2B, Pittsburgh | 26% | 2.8 | Ryan Franklin, RP, St. Louis | 31% | 5.48 |
| Felipe Lopez, SS, Washington | 28% | 3.0 | Kyle Kendrick, SP, Philadelphia | 30% | 5.38 |
| Jason Varitek, C, Boston | 27% | 3.2 | C.J. Wilson, RP, Texas | 29% | 5.21 |
| Carlos Gomez, OF, Minnesota | 32% | 3.3 | R.A. Dickey, SP, Seattle | 31% | 5.08 |
| Mark Kotsay, OF, Atlanta | 26% | 4.6 | Braden Looper, SP, St. Louis | 29% | 5.22 |
|
|
|
Runs Created per 27 Outs (RC/27) -- An estimate of how many
runs a lineup would produce per 27 outs if a particular player
occupied each spot in the order; ex. the RC/27 for Miguel Cabrera
would predict the productivity of a lineup where Cabrera (or his
statistical equal) batted in all nine spots; created by Bill James Component ERA (ERC) -- An estimate of a what a pitcher's ERA would be if it were based solely on actual pitching performance; created by Bill James Base Hits per Balls in Play (H/BIP) -- The percentage of balls in play (at bats minus strikeouts and home runs) that are base hits; research by Voros McCracken and others has established that this rate is largely random and has a norm of approximately 30% Isolated Power -- The difference between slugging percentage and batting average; created by Branch Rickey and Allan Roth Walk Rate -- Walks / (at bats + walks) Whiff Rate -- Strikeouts / at bats |
Al Melchior was recently a Fantasy columnist and data analyst for Baseball HQ and will be providing advice columns for CBSSports.com. Click here to send him a question. Please put "Melchior" in the subject field.


