Fantasy Baseball Draft Prep: How much can pitching projections tell us?
Aaron Sauceda digs into the numbers to show how much we can learn from last year's numbers, as well as pitching projections.
Get ready to build a winning team on Draft Day with SportsLine.com's exclusive stats, tools, and projections. Download the Draft Kit with rankings, tiers, auction values, player breakdowns, projections, and more.
Recently, there's been a lot of chatter on Twitter about the value of projections. They're certainly far from perfect — the creators would admit as much — but they're among the best we have for predicting future performance.
Yet many anti-projection arguments tend to overweight past performance — go dig up Kyle Freeland argument threads on Twitter if you don't believe me. You mean projection systems would dare to project his 2.85 ERA to see serious regression?
But just how good are projections? And while historical stats drive projections, what stats are stickiest year-to-year and most predictive of future performance? In other words, what tools should we be using in our player prognostication toolbox?
To find out, let's break this analysis into two parts — today we'll focus on assessing pitchers and in the next piece we'll look at hitters. Once we have that foundation in place, we'll apply these findings and look at projections in a different light to form a league-winning edge.
ACTUAL VS. PROJECTED STATS
Let's start with appreciating how wildly stats can fluctuate year-to-year, particularly those that many Fantasy gamers play for in traditional 5x5 leagues.
To quantify this, here are the r-squared ("r^2") figures between the traditional Roto stats (excluding saves) in one season and itself in the following season. This includes only starting pitchers who pitched a minimum of 150 innings in each season — the sample is 1,114 player seasons from 2007 to 2018:
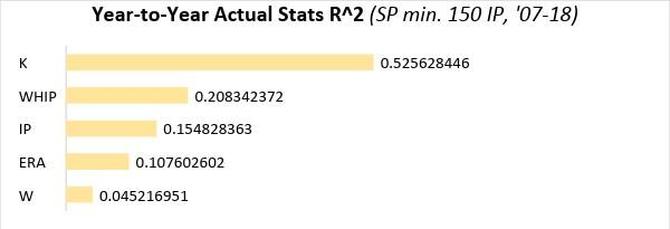
In terms of utility, outside of strikeouts, previous Roto performance is terrible at predicting future performance — using that alone gets us roughly five to 20 percent there, depending on the category. Notice the inclusion and poor testing of innings, as well. More on that later.
Let's see if projections fared any better. Taking an average of Steamer, Depth Charts, THE BAT and ZiPS for 2018 starting pitchers who were projected for at least 75 innings by all systems, here were the r-squared figures for those projections compared to the actual stats shown above:
R-Squared, Actual Stats ('07-18) vs. Projection ('18)
Metric | Actual | Projection | Diff |
K | 0.53 | 0.28 | -46% |
WHIP | 0.21 | 0.24 | 14% |
IP | 0.15 | 0.11 | -27% |
ERA | 0.11 | 0.22 | 107% |
W | 0.05 | 0.19 | 316% |
Now we're getting somewhere! Projections have a significant advantage over previous season wins, ERA and, to a lesser extent, WHIP. If you're relying on previous season's performance in those areas, you're putting yourself at a giant disadvantage. Sorry Kyle Freeland apologists, but his 4.00+ projected ERA is roughly two times more likely to be predictive of his future ERA than last season's 2.85 ERA.
However, it wasn't all rosy for projections. Previous season strikeouts and innings tested as more predictive than projections.
Predicting innings is essentially equivalent to predicting injuries — it's nearly impossible to do with any sort of precision, although it's surprising that previous season innings tested as a better predictor than projected innings. Perhaps that lends some credence to injury research that suggests while injuries appear largely random, the best predictor we have of future injuries are past injuries.
Still, both aren't very adept at projecting innings. Because of our inability to predict innings well — and the massive gap between actual stats and projections in predicting strikeouts — let's assess our two counting stats (strikeouts and wins) on a rate basis instead:
Metric | Actual | Projection | Diff |
K/9 | 0.61 | 0.47 | -23% |
W/IP | 0.02 | 0.13 | 669% |
W/GS | 0.04 | 0.17 | 304% |
Somehow wins as a rate are worse than projected raw wins. What a crapshoot. You're better off just using plain old projected wins — or better yet, getting rid of them from your league. But that's a topic for a different day.
When looking at strikeouts as a rate — K/9 in this case but same goes for K% — we see an improvement for projections relative to actual stats! Projections cut the difference in half. However, it appears that projected K/9 are still more than 20 percent worse at predicting future K/9 than the previous season's K/9. Count this as a win for historical stats.
It wasn't unanimous, but I'd argue this is a big win for projections. They are much better at predicting future ERA and WHIP than the often-cited previous season stats. They're also significantly better at predicting wins. The best place to use previous season's stats would be with strikeouts (K/9 or K%) and potentially innings.
Keep in mind that this projection testing is based on one season. I'd love to test multiple years — similar to how actual stats were tested — but that will be for a different day.
"X" HALF SPLITS
But wait, we've only looked at full season stats so far. What about when someone "figures something out" in the second half — doesn't that tend to carry over? Or maybe someone came out of the gates firing but "tired out" down the stretch. With an offseason of conditioning to address that, they'll resume that same first half performance level, right? Let's find out.
I tested this by using data from FanGraphs for starting pitchers who threw at least 50 first-half ("1H") innings and then 150 innings the next season between 2007-2018 — and repeated the same for second-half numbers ("2H"). I looked at the r-squared between their 1H and 2H numbers in season one to the same stats in the full season two.
I compared that to the r-squared between the full season one to full season two ("Full"). The "Diff" column is telling us how much better the full season was at predicting future performance than the best of the 1H or 2H splits. I've also highlighted in GREEN which split performed the best:
Metric | Full | 1H | 2H | Diff |
IP | 0.15 | 0.08 | 0.13 | 20% |
TBF | 0.13 | 0.06 | 0.12 | 6% |
HR/9 | 0.16 | 0.07 | 0.09 | 90% |
K% | 0.62 | 0.53 | 0.55 | 11% |
BB% | 0.46 | 0.33 | 0.35 | 31% |
K-BB% | 0.55 | 0.44 | 0.47 | 18% |
WHIP | 0.21 | 0.14 | 0.14 | 53% |
BABIP | 0.04 | 0.02 | 0.03 | 27% |
LOB% | 0.02 | 0.02 | 0.02 | 38% |
ERA | 0.11 | 0.07 | 0.06 | 57% |
FIP | 0.31 | 0.20 | 0.21 | 46% |
xFIP | 0.44 | 0.35 | 0.39 | 14% |
LD% | 0.03 | 0.02 | 0.02 | 27% |
GB% | 0.63 | 0.52 | 0.59 | 7% |
FB% | 0.62 | 0.50 | 0.58 | 6% |
Soft% | 0.01 | 0.00 | 0.01 | -42% |
Med% | 0.06 | 0.09 | 0.02 | -27% |
Hard% | 0.07 | 0.06 | 0.03 | 11% |
In essentially every case, you're significantly better off using full season numbers rather than cherry-picked split half numbers. Maybe you know precisely when certain splits are more predictive — perhaps "obvious" cases like injuries or a new pitch — but you also might be overestimating your abilities or falling prey to recency bias. I'd rather bet on the averages (i.e., full season numbers) while others try and spot the outliers.
Also notice how volatile stats like BABIP, LOB%, LD% and "contact management" (soft, medium and hard) are year-to-year — they're not sticky skills so you should avoid relying on them for pitcher evaluation.
"EXPECTED" STATS
We've only had Statcast data since 2015, but it's quickly become the "hot" new thing — and why not, it's cool! Surely these new age stats help us predict pitcher performance better, right? Let's test it.
First, let's see if "expected" stats are better than actual stats in predicting next season's actual performance. Here are r-squared results for actual and "expected" stats in predicting the following season's wOBA, SLG and BA. The data is from 2015-2018 for pitchers who faced at least 150 batters in each season (n = 623 season pairs):
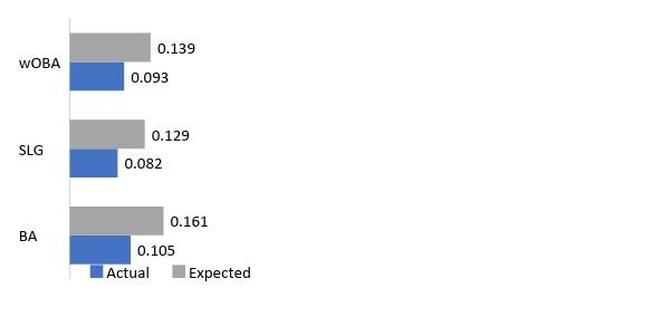
Actually, yes, it looks like "expected" stats have greater predictive utility than their actual stat counterparts! Not only that, but "expected" stats are more than two times stickier year-to-year. Still, that's not saying much as neither do a particularly good job — none of them approach explaining even 20 percent% of the following season's performance in that metric. Worse, they don't help us predict categories like ERA and WHIP any better than what we already had, such as ERA estimators like SIERA and xFIP.
Jonathan Judge of Baseball Prospectus found similar results when testing Statcast data, finding that their "expected" metrics didn't appreciably outperform existing metrics like FIP and DRA.
When testing these Statcast metrics, I also didn't find there to be much predictive value in exit velocities — perhaps this helps explain why "expected" stats didn't perform well. Here are the r-squared figures between the metric and itself year-to-year, also known as "stickiness":
Metric | R^2 |
Avg Distance | 0.57 |
EV 95+ | 0.39 |
EV 95+ % | 0.10 |
Avg EV | 0.09 |
FB/LD EV | 0.08 |
GB EV | 0.04 |
Max EV | 0.02 |
Max Distance | 0.01 |
Avg HR Distance | 0.00 |
As alluded to above, this seriously questions "contact management" as a skill. For example, a pitcher's previous season's average exit velocity explains only 9 percent of the next season's average exit velocity. It gets worse when isolating for only fly balls, line drives and grounders.
While average distance and number of balls hit 95+ MPH appear quite sticky, they don't help us predict future performance any better — their relationship with future ERA, WHIP, SLG and wOBA is almost non-existent.
It's a similar story for launch angle-related measures:
Metric | R^2 |
Avg Launch Angle | 0.68 |
Barrels | 0.34 |
Angle Sweet Spot% | 0.15 |
Barrels/PA % | 0.11 |
Barrels/BBE % | 0.09 |
While launch angle is very sticky year-to-year, it doesn't inherently help us predict future pitcher performance any better than exit velocity-related metrics. Similar story for barrels.
TRADITIONAL 5x5 SUMMARY
Let's put these metrics to the test — how do they help us predict the traditional starting pitcher roto categories? Summarizing by category:
ERA
Metric | R^2 |
Proj. | 0.223 |
SIERA | 0.193 |
xFIP | 0.183 |
K-BB% | 0.176 |
FIP | 0.174 |
K% | 0.167 |
ACES | 0.164 |
SC xwOBA | 0.141 |
WHIP
Metric | R^2 |
K-BB% | 0.294 |
SIERA | 0.251 |
Proj. | 0.238 |
K% | 0.218 |
xFIP | 0.213 |
WHIP | 0.208 |
ACES | 0.205 |
FIP | 0.200 |
STRIKEOUTS (K%)
Metric | R^2 |
K% | 0.615 |
K-BB% | 0.514 |
Proj. | 0.470 |
SwStr% | 0.464 |
Contact% | 0.456 |
SIERA | 0.360 |
Z-Contact% | 0.343 |
ACES | 0.337 |
WINS
Metric | R^2 |
Proj. | 0.188 |
FIP | 0.104 |
SIERA | 0.100 |
xFIP | 0.094 |
K | 0.093 |
K-BB% | 0.088 |
K% | 0.074 |
INNINGS
Metric | R^2 |
IP | 0.155 |
TBF | 0.121 |
Proj. | 0.113 |
Pitches | 0.103 |
KEY TAKEAWAYS FOR EVALUATING PITCHERS
As you can see, predicting future pitching performance is hard! Going back to our original question — just how good are projections and other measures at predicting future performance? Outside of strikeouts, projections and other predictive stats only get us 20-30 percent of the way there, at best.
So how should we apply what we learned here? Let's summarize:
- Projections absolutely need to be used versus the actual stat itself from previous seasons, particularly for ERA, WHIP and wins — you're foregoing a massive edge by leaning on historical figures for these categories
- When evaluating pitchers, bet on strikeouts — among traditional 5x5 categories, that's the category that we're far-and-away best equipped to predict
- Use an array of metrics when evaluating and projecting pitchers: projections, ERA estimators (SIERA, DRA, xFIP, FIP), K-BB%, K% and ACES
- Full season stats are better than half-season splits — 2H and 1H splits are similar with 2H having a slight edge over 1H across most metrics, particularly for batted balls (GB%, FB%) and playing time/health (IP, TBF)
- Statcast's "expected" stats are better than their actual stat counterparts at predicting future BA, SLG and wOBA against — however, they don't help us predict future pitching performance any better than existing metrics such as SIERA and xFIP in categories such as ERA and WHIP
- "Contact management" is not a skill and doesn't help us predict future performance — pitcher exit velocities allowed are not sticky year-to-year and the same goes for soft, medium and hard contact allowed
- Launch angles and batted balls (GB%, FB%) are sticky year-to-year but they don't help us predict future pitching performance
These are the stats you should be using when assessing and predicting a pitcher's performance across the traditional Roto categories:
- ERA: Projected ERA, ERA estimators, K-BB%, K% and ACES
- WHIP: K-BB%, projected WHIP, SIERA
- Strikeouts: K%, K-BB%, projected K% or K/9
- Wins: Projected wins
- Innings: Previous season's IP/TBF and projected IP
Following a similar analysis for hitters and in the next iteration of this series, we'll talk about how to approach projecting performance in a more robust way than solely looking at median projections.
In the meantime, we hope this analysis gives you the edge to know what to look at and what not to look at while your competitors are poking around in the wrong places.
YEAR-TO-YEAR STICKINESS
For reference, I've also included the year-to-year stickiness of all the metrics I tested. This is measuring the year-to-year relationship with the metric in one season with itself in the next season. The higher the r-squared, the stickier and more reliable it is year-to-year (use these metrics). The lower the r-squared, the more volatile (don't use these metrics):
Metric | R^2 |
ACES | 0.764 |
Avg Launch Angle | 0.675 |
GB% | 0.627 |
SwStr% | 0.622 |
FB% | 0.617 |
K% | 0.615 |
K/9 | 0.615 |
Contact% | 0.608 |
Avg Distance | 0.574 |
O-Contact% | 0.556 |
Z-Contact% | 0.554 |
K-BB% | 0.553 |
K | 0.526 |
O-Swing% | 0.501 |
BB% | 0.455 |
SIERA | 0.455 |
xFIP | 0.444 |
Z-Swing% | 0.433 |
EV 95+ | 0.388 |
Barrels | 0.338 |
FIP | 0.312 |
WHIP | 0.208 |
HR/9 | 0.163 |
IP | 0.155 |
Angle Sweet Spot% | 0.153 |
Pitches | 0.148 |
TBF | 0.129 |
HR/FB | 0.111 |
ERA | 0.108 |
Barrels/PA % | 0.106 |
EV 95+ % | 0.099 |
Avg EV | 0.093 |
Barrels/BBE % | 0.090 |
FB/LD EV | 0.080 |
Hard% | 0.067 |
Med% | 0.065 |
W | 0.045 |
GB EV | 0.043 |
BABIP | 0.039 |
LD% | 0.027 |
LOB% | 0.025 |
GS | 0.018 |
Max EV | 0.018 |
Max Distance | 0.014 |
Soft% | 0.006 |
G | 0.003 |
Avg HR Distance | 0.001 |