College football's winningest teams of the CFP era: Ranking every FBS program's record since 2014
Which teams have consistently managed to rise above the rest in the 12 years since the College Football Playoff began?

The College Football Playoff era has always been about crowning a champion. But over the past 12 seasons, it has also quietly revealed something else: which programs can actually sustain success in a sport that rarely sits still.
From the four-team format's inception to now, college football has undergone a full-scale transformation. The introduction of the transfer portal reshaped roster building, while NIL deals and revenue sharing turned recruiting into something closer to free agency.
The sport looks and operates very differently than it did before 2014.
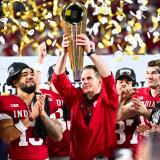
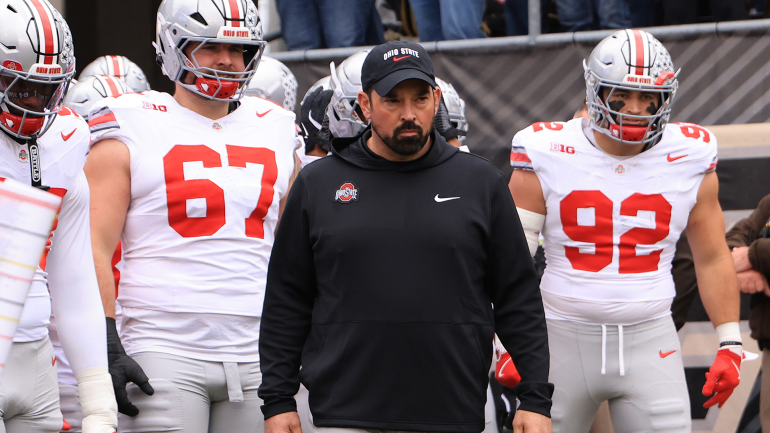
And yet, at the top, a familiar group has largely held its ground. Ohio State, Alabama, Georgia and Clemson -- the winningest programs of the CFP era -- have separated themselves not just with championships, but with consistency. What separates them isn't just peak seasons, but the ability to stack wins year after year.
For most programs, maintaining that level of consistency has been nearly impossible.
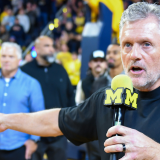
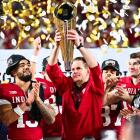
Recent seasons illustrate just how volatile the CFP era can be. Indiana, for example, surged under Curt Cignetti to become the winningest FBS program over the past two seasons and captured a national title -- yet over the full era, the Hoosiers sit at 76-72 (.514) -- 75th nationally. Meanwhile, Oklahoma State ranked inside the top 20 in winning percentage after 2023, but after posting just four victories over the past two seasons, it has fallen to 36th in the FBS.
That shows just how difficult sustained success has been in this era -- and how quickly programs can rise and fall in the modern game.
At the other end of the spectrum, teams like Charlotte, Kent State, UTEP, Kansas and UMass have struggled to find traction across the CFP era, ranking as the five worst programs in the FBS during that span.
Here is a look at the winning percentage for all of last year's 136 FBS teams since 2014, ranked from best to worst.
Which FBS teams have the best winning percentage since 2014?
* denotes team became FBS member after 2014
| Rank | Team | Wins | Losses | Win % | |
|---|---|---|---|---|---|
1 |  | Ohio State | 141 | 19 | .881 |
2 |  | Alabama | 147 | 22 | .870 |
3 |  | Georgia | 137 | 27 | .835 |
4 |  | Clemson | 136 | 30 | .819 |
5 |  | James Madison* | 40 | 11 | .784 |
6 |  | 119 | 37 | .763 | |
7 |  | 118 | 39 | .752 | |
8 |  | 116 | 41 | .739 | |
9 |  | 115 | 42 | .732 | |
10 |  | 111 | 41 | .730 | |
11 |  | 108 | 48 | .692 | |
12 |  | 107 | 48 | .690 | |
13 |  | 106 | 48 | .688 | |
14 |  | 105 | 49 | .682 | |
14 |  | 105 | 49 | .682 | |
16 |  | 102 | 49 | .675 | |
16 |  | 102 | 49 | .675 | |
18 |  | 99 | 51 | .660 | |
19 |  | Jacksonville State* | 27 | 14 | .659 |
20 |  | 101 | 54 | .652 | |
21 |  | 99 | 53 | .651 | |
22 |  | 65 | 35 | .650 | |
23 |  | 99 | 54 | .647 | |
24 |  | 96 | 55 | .636 | |
24 |  | 96 | 55 | .636 | |
26 |  | 95 | 55 | .633 | |
27 |  | 92 | 55 | .626 | |
28 |  | 95 | 57 | .625 | |
28 |  | 95 | 57 | .625 | |
30 |  | 96 | 59 | .619 | |
30 |  | 96 | 59 | .619 | |
32 |  | 90 | 56 | .616 | |
33 |  | 97 | 62 | .610 | |
34 |  | 92 | 59 | .609 | |
35 |  | 90 | 59 | .604 | |
36 |  | Oklahoma State | 93 | 61 | .604 |
37 |  | 92 | 61 | .601 | |
38 |  | 91 | 61 | .599 | |
39 |  | 89 | 60 | .597 | |
40 |  | 93 | 63 | .596 | |
41 |  | 90 | 61 | .596 | |
42 |  | 89 | 61 | .593 | |
43 |  | 89 | 62 | .589 | |
43 |  | 89 | 62 | .589 | |
45 |  | 90 | 64 | .584 | |
46 |  | 88 | 63 | .583 | |
47 |  | 86 | 62 | .581 | |
48 |  | 88 | 64 | .579 | |
49 |  | 87 | 64 | .576 | |
50 |  | 86 | 65 | .570 | |
51 |  | 64 | 49 | .566 | |
52 |  | 81 | 64 | .559 | |
53 |  | 86 | 68 | .558 | |
54 |  | 81 | 65 | .555 | |
55 |  | 83 | 67 | .553 | |
55 |  | 83 | 67 | .553 | |
57 |  | 83 | 68 | .550 | |
58 |  | 83 | 69 | .546 | |
59 |  | 81 | 68 | .544 | |
60 |  | 67 | 57 | .540 | |
61 |  | Delaware* | 7 | 6 | .538 |
61 |  | Missouri State* | 7 | 6 | .538 |
63 |  | 78 | 67 | .538 | |
64 |  | 80 | 70 | .533 | |
65 |  | 81 | 71 | .533 | |
66 |  | 80 | 72 | .526 | |
66 |  | 80 | 72 | .526 | |
68 |  | 79 | 72 | .523 | |
69 |  | 79 | 73 | .520 | |
70 |  | 80 | 74 | .519 | |
71 |  | 77 | 72 | .517 | |
72 |  | Indiana | 76 | 72 | .514 |
73 |  | 77 | 73 | .513 | |
74 |  | 76 | 73 | .510 | |
75 |  | 77 | 74 | .510 | |
75 |  | 77 | 74 | .510 | |
77 |  | 78 | 75 | .510 | |
78 |  | 77 | 75 | .507 | |
79 |  | 75 | 74 | .503 | |
80 |  | 74 | 74 | .500 | |
81 |  | 72 | 73 | .497 | |
82 |  | Miami (Ohio) | 72 | 74 | .493 |
83 |  | 71 | 73 | .493 | |
84 |  | 70 | 73 | .490 | |
85 |  | 72 | 76 | .486 | |
86 |  | USF | 71 | 76 | .483 |
87 |  | 71 | 78 | .477 | |
88 |  | 72 | 80 | .474 | |
89 |  | 69 | 77 | .473 | |
90 |  | 67 | 75 | .472 | |
91 |  | 68 | 77 | .469 | |
92 |  | Kennesaw State* | 12 | 14 | .462 |
93 |  | 69 | 81 | .460 | |
94 |  | 68 | 80 | .459 | |
95 |  | 67 | 79 | .459 | |
95 |  | 67 | 79 | .459 | |
97 |  | 66 | 79 | .455 | |
98 |  | 65 | 78 | .455 | |
99 |  | 61 | 75 | .449 | |
100 |  | 65 | 80 | .448 | |
101 |  | 68 | 86 | .442 | |
102 |  | 63 | 82 | .434 | |
103 |  | 64 | 84 | .432 | |
104 |  | 61 | 81 | .430 | |
105 |  | 62 | 83 | .428 | |
106 |  | 63 | 85 | .426 | |
107 |  | 60 | 81 | .426 | |
108 |  | 61 | 83 | .424 | |
109 |  | 62 | 85 | .422 | |
110 |  | 62 | 85 | .422 | |
111 |  | 62 | 86 | .419 | |
112 |  | 59 | 86 | .407 | |
113 |  | 15 | 22 | .405 | |
114 |  | 58 | 86 | .403 | |
115 |  | 56 | 85 | .397 | |
116 |  | 57 | 87 | .396 | |
117 |  | 56 | 86 | .394 | |
118 |  | 56 | 88 | .389 | |
119 |  | 55 | 91 | .377 | |
120 |  | 53 | 89 | .373 | |
120 |  | 53 | 89 | .373 | |
122 |  | 52 | 89 | .369 | |
123 |  | 53 | 92 | .366 | |
124 |  | 53 | 94 | .361 | |
125 |  | 52 | 93 | .359 | |
126 |  | 51 | 92 | .357 | |
127 |  | 47 | 92 | .338 | |
128 |  | 48 | 94 | .338 | |
129 |  | 45 | 91 | .331 | |
130 |  | 45 | 96 | .319 | |
131 |  | 43 | 100 | .301 | |
132 |  | Charlotte | 38 | 89 | .299 |
133 |  | Kent State | 40 | 98 | .290 |
134 |  | UTEP | 41 | 101 | .289 |
135 |  | Kansas | 39 | 104 | .273 |
136 |  | UMass | 24 | 112 | .176 |